- Trading
- Trading
- Markets
- Markets
- Products
- Forex
- Commodities
- Metals
- Indices Trading
- Share CFDs Trading
- Cryptocurrency CFDs
- Treasury CFDs
- ETF CFDs Trading
- Accounts
- Accounts
- Compare our accounts
- Open account
- Try free demo
- GO Markets Social
- Platforms & tools
- Platforms & tools
- Platforms
- Platforms
- Platforms overview
- MetaTrader 4
- MetaTrader 5
- Mobile Trading Platforms
- Premium trading tools
- Premium trading tools
- Tools overview
- VPS
- Genesis
- Education
- Education
- Resources
- Resources
- News & Analysis
- Education Hub
- Economic Calendar
- Earnings announcements
- Courses
- Courses
- Introduction to forex
- First steps in forex
- Next steps in forex
- Help & support
- Help & support
- About
- About
- About GO Markets.
- Our awards
- Sponsorships
- Client support
- Client support
- Contact us
- FAQs
- Quick support
- Holiday trading hours
- Fraud and scam awareness
- Legal documents
- Trading
- Trading
- Markets
- Markets
- Products
- Forex
- Commodities
- Metals
- Indices Trading
- Share CFDs Trading
- Cryptocurrency CFDs
- Treasury CFDs
- ETF CFDs Trading
- Accounts
- Accounts
- Compare our accounts
- Open account
- Try free demo
- GO Markets Social
- Platforms & tools
- Platforms & tools
- Platforms
- Platforms
- Platforms overview
- MetaTrader 4
- MetaTrader 5
- Mobile Trading Platforms
- Premium trading tools
- Premium trading tools
- Tools overview
- VPS
- Genesis
- Education
- Education
- Resources
- Resources
- News & Analysis
- Education Hub
- Economic Calendar
- Earnings announcements
- Courses
- Courses
- Introduction to forex
- First steps in forex
- Next steps in forex
- Help & support
- Help & support
- About
- About
- About GO Markets.
- Our awards
- Sponsorships
- Client support
- Client support
- Contact us
- FAQs
- Quick support
- Holiday trading hours
- Fraud and scam awareness
- Legal documents
- Home
- News & Analysis
- Forex
- Short term break out on the EURUSD
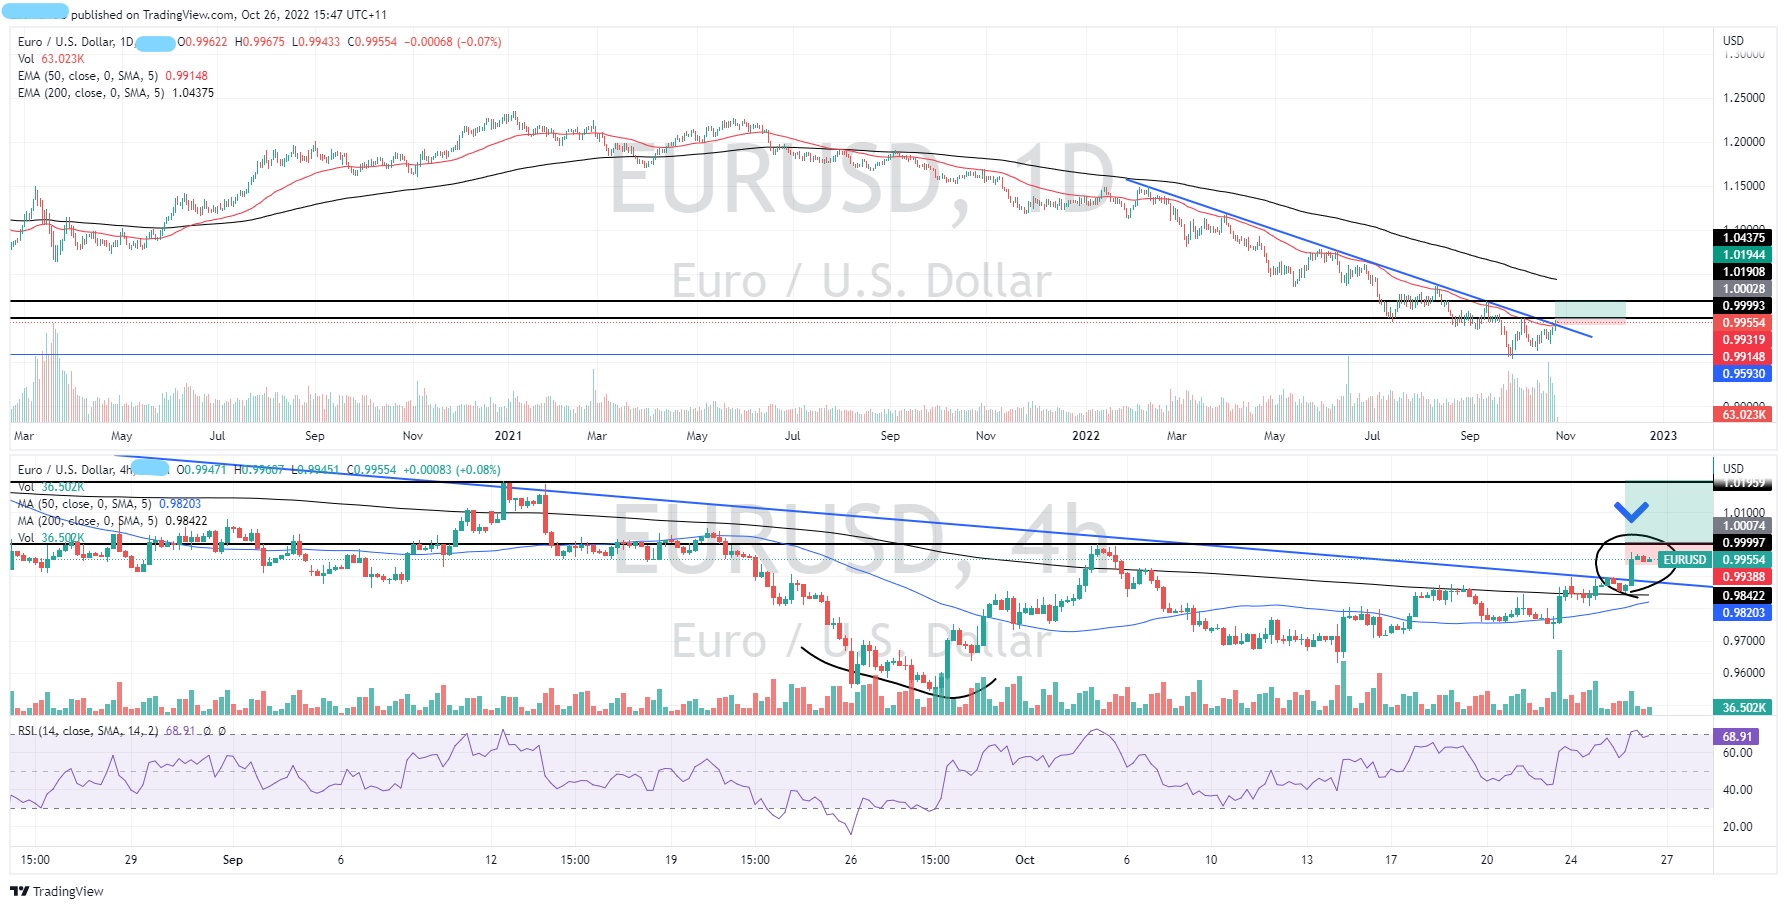
News & AnalysisThe EURUSD is showing some signs of a potential short term break out on the daily and 4-hour time price charts. This is largely a technical breakout, although it is also supported by a shift in sentiment towards growth assets and away from the USD in the last week.
Technical Analysis

The daily cart shows a long term down trend with the price respecting the trend. On the daily time frame, the price has broken through the trend line. In addition, the price has broken above the 50 period Exponential Moving Average. This represents a short-term support level and a good position for a trailing stop loss or hard stop loss.
Looking at the 4-hour chart provides a more direct profit target and entry trigger. The chart shows that the candle sticks are forming into what may become a flag. An entry based on the current price action may be triggered by a breakout of the flag past 1.000 which is also the parity level. This level also presents as the neckline for a double bottom. This further indicates a potential bottom, or a reversal is about to take place. Using the 50-day Exponential moving average as the position for the stop loss at 0.9914, and the next resistance as a profit target at 1.0200 gives the trade yields a Risk Reward ratio of nearly 2.7.
With volatility surrounding the market being relatively high there is still risks with this trade and traders should be aware of potential macro factors that may impact on the trade.
Ready to start trading?
Disclaimer: Articles are from GO Markets analysts and contributors and are based on their independent analysis or personal experiences. Views, opinions or trading styles expressed are their own, and should not be taken as either representative of or shared by GO Markets. Advice, if any, is of a ‘general’ nature and not based on your personal objectives, financial situation or needs. Consider how appropriate the advice, if any, is to your objectives, financial situation and needs, before acting on the advice. If the advice relates to acquiring a particular financial product, you should obtain and consider the Product Disclosure Statement (PDS) and Financial Services Guide (FSG) for that product before making any decisions.
Next Article
Boeing’s Q3 results have landed – the stock is down
The Boeing Company (NYSE:BA) announced Q3 earnings results before the market open in the US on Wednesday. The world’s largest aerospace company reported revenue that missed analyst expectations at $15.956 billion (up by 4% year-over-year) vs. $17.911 billion estimate. The company reported a loss per share of -$6.18 per share vs. $0.132 earn...
October 27, 2022Read More >Previous Article
Coca-Cola tops Wall Street Q3 estimates
Coca-Cola tops Wall Street Q3 estimates The Coca-Cola Company (NYSE:KO) reported Q3 financial results before the market open on Tuesday. The US ...
October 26, 2022Read More >

